

In this article, we cover the current U.S. inflation rate, what inflation is, how inflation is calculated, who measures inflation, what inflation rates have been in the past, and more information about inflation.
The inflation rate in May 2023 was 4% based on a Consumer Price Index for the U.S. of 304.127. Inflation decreased by -0.9% between April 2023 and May 2023.
Current Inflation Information
If you watch the news, pick up a newspaper, or discuss current events in the U.S., a topic that has almost certainly come up is inflation.
While most people understand that inflation leads to price increases for goods and services, that is about as far as the general knowledge of inflation goes.
Understanding what inflation is, how its caused, and how it is measured helps have a more thorough understanding of the U.S. economy and how business and personal spending are being impacted.
U.S. Inflation Rate History
Recently, inflation has been a regular topic of conversation among businesses and consumers. As the U.S. economy largely began recovering from the pandemic and consumers began spending and earning more money, the inflation rate experienced rapid growth.
This growth in inflation is partly due to the large influx of money being injected into the economy to keep businesses, families, and individuals afloat while businesses were shut down and many employees could not work.
In addition to these factors driving inflation growth, many believe that businesses are seizing on the opportunity to increase prices in a more aggressive manner while attributing those price increases to inflation and monetary policy decisions.
U.S. Inflation Rate by Month
The monthly growth between January 2021 and May 2023 is highlighted in the graph below, growing from 1.4% to 4%!
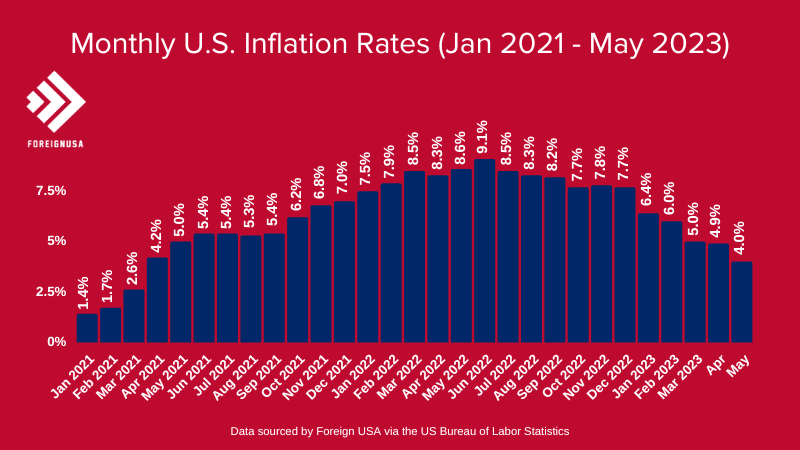
The table below displays the monthly U.S. inflation rates for 2021, 2022, and some of 2023.
| Month | Year | Seasonally Adjusted Inflation Rate |
|---|---|---|
| May 2023 Inflation | 2023 | -0.9% |
| April 2023 Inflation | 2023 | -0.1% |
| March 2023 Inflation | 2023 | -1.0% |
| February 2023 Inflation | 2023 | -0.4% |
| January 2023 Inflation | 2023 | 0.5% |
| December Inflation | 2022 | -0.1% |
| November Inflation | 2022 | 0.1% |
| October Inflation | 2022 | 0.4% |
| September Inflation | 2022 | 0.4% |
| August Inflation | 2022 | 0.1% |
| July Inflation | 2022 | 0.0% |
| June Inflation | 2021 | 0.9% |
| May Inflation | 2021 | 0.7% |
| April Inflation | 2021 | 0.6% |
| March Inflation | 2021 | 0.6% |
| February Inflation | 2021 | 0.4% |
| January Inflation | 2021 | 0.2% |
Inflation Rate by Year
In many cases, the month-to-month increase in the inflation rate can be rapid, but when looked at in the context of annualized inflation, it is more tempered.
In June 2006, the inflation rate increased by 4%, but over the following twelve months, the rate averaged 2.3%. The current case in the U.S. is somewhat different, as the U.S. inflation rate has been high and sustained for some time.
The annual growth in the chart and table below shows that 2021 and 2022 are significantly higher than in previous years, which is what many households and businesses are struggling with.
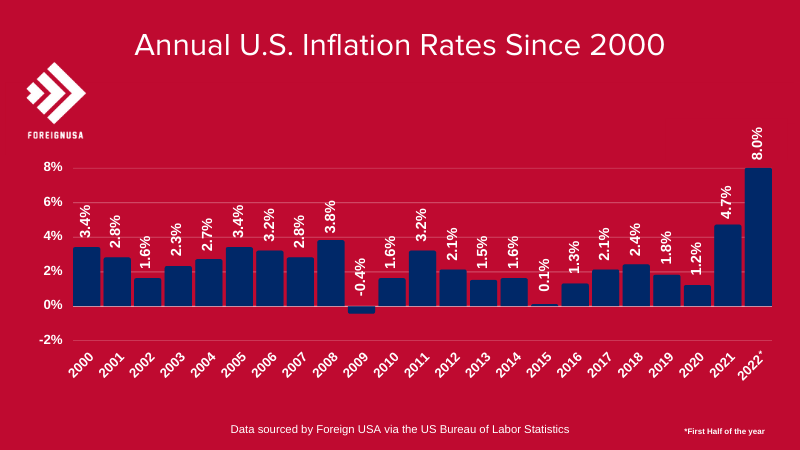
This table displays the annual inflation rates dating back to 2000.
| Year | US Annual Inflation Rate |
|---|---|
| 2022 | 8% |
| 2021 | 4.7% |
| 2020 | 1.2% |
| 2019 | 1.8% |
| 2018 | 2.4% |
| 2017 | 2.1% |
| 2016 | 1.3% |
| 2015 | 0.1% |
| 2014 | 1.6% |
| 2013 | 1.5% |
| 2012 | 2.1% |
| 2011 | 3.2% |
| 2010 | 1.6% |
| 2009 | -0.4% |
| 2008 | 3.8% |
| 2007 | 2.8% |
| 2006 | 3.2% |
| 2005 | 3.4% |
| 2004 | 2.7% |
| 2003 | 2.3% |
| 2002 | 1.6% |
| 2001 | 2.8% |
| 2000 | 3.4% |
What Exactly is Inflation?
Inflation is defined by the Federal Reserve (the Fed), the central bank of the United States, as “the increase in the prices of goods and services over time.” While this sounds relatively straightforward, some considerations make the definition a bit more complex.
Inflation does not account for a single product or service (e.g., a gallon of milk or gas) or even several products or services (e.g., groceries) but rather reflects the overall price level increase for goods and services in the economy.
Inflation can be evaluated on a month-to-month basis, a quarterly basis, or an annual basis. Volatility between months can sometimes be an outlier, so looking at broader inflationary trends can be helpful when evaluating inflation.
What Causes Inflation?
Different factors in the U.S. economy can impact inflation rates. When the Fed lowers interest rates, inflation tends to rise, or inflation can rise when the supply of money increases too rapidly.
Other monetary policy decisions can impact inflation, for example, increasing government spending, subsidies to businesses, laws that impact supply chains, and more.
During the pandemic, significant influxes of money into the U.S. economy and the hands of consumers are believed to have partially contributed to the current inflationary situation. While this was, in part, expected (as historical data reflects injecting money into the economy can lead to high inflation), it is widely accepted that the potential impact to consumers and businesses had this money not been injected into the economy could have been far more negatively impactful to consumers and businesses.
Is Inflation a Bad Thing?
Generally speaking, inflation is not inherently a bad thing. If monetary policies are enacted that can keep the average inflation rate under control, inflation reflects growth in the economy.
A low rate of inflation often reflects growth in the economy. When percent changes in inflation are controlled, that change can be associated with positive economic indicators.
A negative percentage change in the inflation rate (also called deflation) is also not inherently a bad thing – when inflation grows too quickly, government actions can be enacted to drive down the inflation rate in a sustainable manner. Negative outcomes of inflation and deflation generally occur when rates change too rapidly.
How is Inflation Measured?
Inflation is measured based on the Consumer Price Index, also known as the CPI. This index is designed to measure how price changes impact the majority of the U.S. population (approximately 93% of the population representing all urban consumers).
The CPI is calculated based on the growth rate, or the change in the price of approximately 80,000 items each month, by the U.S. Bureau of Labor Statistics (the BLS).
Every month, the BLS surveys American families through the Consumer Expenditures Survey program, which gathers data on expenditures, income, and demographics of consumers. The BLS uses two surveys as a part of this program, the Interview Survey and the Diary Survey.
The Interview Survey and Diary Survey
The Interview Survey covers major and/or recurring items purchased by consumers. In general, this survey records expenditures that are large, such as those for property, automobiles, and major appliances, or those which recur on a regular basis, such as rent, utilities, or insurance.
The Diary Survey collects data on frequently purchased items by asking consumers to keep a diary of purchases. These types of purchases include food and beverage expenditures at home and in eating places; housekeeping supplies and services; nonprescription drugs; and most personal care products and services.
These types of expenditures can be difficult to recall even a few weeks after purchase which is why the diary method is used.
The BLS relies on the U.S. Census Bureau to collect this data through the Consumer Expenditure Survey (CE). When combined, the data covers the complete range of consumer expenditures.
Reporting the U.S. Inflation Rate
Once the U.S. Census Bureau collects data and shares it with the BLS, the price increases or decreases are calculated as an index showing the overall changes in prices.
Each month, the index can fluctuate with a degree of volatility, but when a few months are compared to one another, or year-over-year change is evaluated, a more accurate and valuable measurement of inflation becomes available.
What is Deflation?
Deflation is effectively the same thing as inflation, but it represents prices decreasing instead of increasing. Deflation is generally caused by a decrease in demand from consumers, which leads to a reduction in the prices of goods.
Deflation can occur organically (e.g., stock market troubles, consumer sentiment shifts towards increasing savings) or deliberately (e.g., the Fed raising interest rates, changing monetary policy, or reducing government spending).
In the short term, consumers can benefit from deflation as the price of goods becomes more affordable, but in some cases, deflation can be a warning sign of an upcoming recession, a decline in wages, or an increased unemployment rate.
What does Inflation Impact?
Most clearly, inflation impacts the prices that consumers pay for goods and services – for example, food prices, health care/medical care costs, gas prices, and more. However, inflation also impacts nearly all aspects of the economy, such as GDP, interest rates, producer prices, transportation costs, tax policies, business investment rates, and much more.
The Future of Inflation in the U.S.
Monthly and annual inflation rates can be impossible to predict accurately and consistently – many economists and policymakers do their best to create estimates, but far too many factors impact the CPI and inflation rate.
Current governmental policies and Fed decisions (especially on interest rates) are meant to temper growth in inflation – these include interest rate hikes, lowering the cost of gas and energy, lowering prescription and health care costs, helping U.S.-farmers increase production to lower food costs, using targeted support to areas of the economy that can lower the cost of goods (e.g., supply chains and infrastructure), and more.