Foreign Nationals who would like to live and work in the U.S. may qualify to do so under the E2 Treaty Investor Visa. While there are several requirements you must meet to be eligible, the first and most important one is that you are a national of a treaty country.
We have created an E2 country list, showing you all of the 81 countries in which the United States has a treaty of commerce and navigation (9 FAM 402.9-10). We have also noted the year these relationships and agreements were formed.
The E2 Treaty Investor visa has evolved to become an extremely popular visa of choice with many entrepreneurs and business owners since there is no minimum investment required, the non-immigrant visa can be extended almost indefinitely (assuming you still qualify), and you do not need a job offer from a U.S. company.
Under E2 visa requirements, you are, in essence, setting up your own company in the U.S. and making a substantial investment in either a start-up company, a franchise, or purchasing part or all of an existing business that you intend to grow over the ensuing years.

While one of the main components of the E2 visa is that you make a substantial investment, sometimes the investment does not have to be as substantial as many people are led to believe.
Related: What is the E2 Visa Investment Amount?
There are other requirements of the E2 Treaty Investor visa, such as creating employment for U.S. workers, making a positive impact on the local or national economy, generating more than enough of a living for yourself and your family as the principal E2 treaty investor, and demonstrating you can operate a business at the highest level, and make a profit.
E2 Treaty Countries
The E2 treaty investor visa suits entrepreneurs and business owners who want to start a new business in the U.S., purchase an existing business or franchise, or take a majority ownership and controlling interest in an existing U.S. company.
The E2 visa is not just for those with prior experience in running a business, many would-be entrepreneurs are also eligible to apply who would like to be in business for themselves and create a new life in the United States.
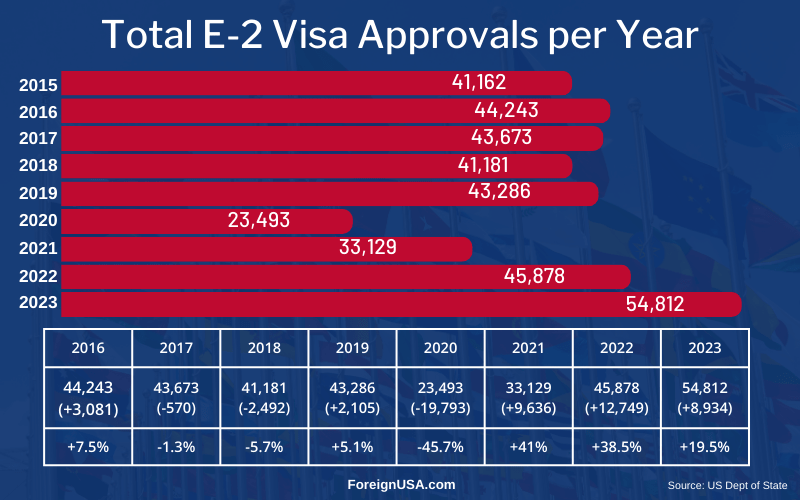
As you can see from the following graphic, the U.S. Department of State has approved thousands of E2 visas for foreign nationals and continues to do so annually.
Apart from the height of the pandemic, the rate of E2 visa approvals has largely been increasing or remaining at the same level year-on-year.
The graphic below shows the total number of E2 visas approved each year (including the principal applicant, spouse, and any dependent children) from 2015 through 2023, the increase or decrease in the number of visas approved, and the percentage increase or decrease.

As you will see from the graphic above, the number of E-2 visas issued almost halved in 2020 during the height of the pandemic. It bounced back quite significantly in 2021, with 9,636 more E-2 visas issued, then in 2022, 45,878 E-2 visas were issued, which represented an impressive bounce back, and 2023 saw the highest number of E2 visas issued on record, increasing to 54,812!
These numbers were sourced from the official U.S. Department of State website, under the total number of E2 visa issuances for the 2023 FY (Fiscal Year).
Complete E2 Country List
Regardless of whether your investment for the E2 enables you to apply for the visa, you must be from a country that holds a treaty of commerce and navigation with the U.S.
We have created a table below listing which countries are eligible for the E2 Visa and the date each treaty came into force.
You will also find links to certain E2 visa treaty nations that will take you to a country-specific page we have created that has more in-depth information and statistics about that particular country and its E2 visa approval rates.
Also, it is important to note that if you are a national of a country listed below but are living in a country that is not an E2 Visa treaty country, you may still qualify since the E2 is based on the country you are a national of, not necessarily the country you might be currently living in.
| E2 Treaty Countries List | Date of Treaty |
|---|---|
| Albania | January 4, 1998 |
| Argentina | December 20, 1854 |
| Armenia | March 29, 1996 |
| Australia | December 27, 1991 |
| Austria | May 27, 1931 |
| Azerbaijan | August 2, 2001 |
| Bahrain | May 30, 2001 |
| Bangladesh | July 25, 1989 |
| Belgium | October 3, 1963 |
| Bolivia | June 6, 2001 |
| Bosnia and Herzegovina | November 15, 1982 |
| Bulgaria | June 2, 1954 |
| Cameroon | April 6, 1989 |
| Canada | January 1, 1994 |
| Chile | January 1, 2004 |
| Taiwan | November 30, 1948 |
| Colombia | June 10, 1948 |
| Congo (Brazzaville) | August 13, 1994 |
| Congo (Kinshasa) | July 28, 1989 |
| Costa Rica | May 26, 1852 |
| Croatia | November 15, 1982 |
| Czech Republic | January 1, 1993 |
| Denmark | December 10, 2008 |
| Ecuador | May 11, 1997 |
| Egypt | June 27, 1992 |
| Estonia | February 16, 1997 |
| Ethiopia | October 8, 1953 |
| Finland | December 1, 1992 |
| France | December 21, 1960 |
| Georgia | August 17, 1997 |
| Germany | July 14, 1956 |
| Grenada | March 3, 1989 |
| Honduras | July 19, 1928 |
| Ireland | November 18, 1992 |
| Israel | May 1, 2019 |
| Italy | July 26, 1949 |
| Jamaica | March 7, 1997 |
| Japan | October 30, 1953 |
| Jordan | December 17, 2001 |
| Kazakhstan | January 12, 1994 |
| South Korea | November 7, 1957 |
| Kosovo | November 15, 1882 |
| Kyrgyzstan | January 12, 1994 |
| Latvia | December 26, 1996 |
| Liberia | November 21, 1939 |
| Lithuania | November 22, 2001 |
| Luxembourg | March 28, 1963 |
| North Macedonia | November 15, 1982 |
| Mexico | January 1, 1994 |
| Moldova | November 25, 1994 |
| Mongolia | January 1, 1997 |
| Montenegro | November 15, 1882 |
| Morocco | May 29, 1991 |
| Netherlands | December 5, 1957 |
| New Zealand | June 10, 2019 |
| Norway | January 18, 1928 |
| Oman | June 11, 1960 |
| Pakistan | February 12, 1961 |
| Panama | May 30, 1991 |
| Paraguay | March 07, 1860 |
| Philippines | September 6, 1955 |
| Poland | August 6, 1994 |
| Romania | January 15, 1994 |
| Senegal | October 25, 1990 |
| Serbia | November 15,1882 |
| Singapore | January 1, 2004 |
| Slovak Republic | January 1, 1993 |
| Slovenia | November 15, 1982 |
| Spain | April 14, 1903 |
| Sri Lanka | May 1, 1993 |
| Suriname | February 10, 1963 |
| Sweden | February 20, 1992 |
| Switzerland | November 08, 1855 |
| Thailand | June 8, 1968 |
| Togo | February 5, 1967 |
| Trinidad & Tobago | December 26, 1996 |
| Tunisia | February 7, 1993 |
| Turkey | May 18, 1990 |
| Ukraine | November 16, 1996 |
| United Kingdom | July 03, 1815 |


