If you are looking for information about the population and demographics of Houston, Texas, then you have come to the right place! We have gathered some of the key demographic information for the city in one easy-to-use and navigate page.
Find out about the population growth in the city, the population of different races or genders in Houston, Texas, and other useful information.
Houston is the largest city in the state of Texas, with a population in 2022 of 2,363,086, according to the U.S. Census Bureau. The majority of Houston’s 672 square miles are located in Harris County with smaller parts of the city located in the counties of Fort Bend and Montgomery.
Through 2027, the population of Houston is projected to increase by 4.8% to 2,476,126. It is the fourth largest city in the United States, and Houston has a population density of over 3,758 people per square mile. As the fourth largest U.S. city, it only trails (in size) behind New York, Los Angeles, and Chicago.
Houston Population Growth
Houston has experienced rapid growth in population, with the population increasing by 19.6% over the last twelve years, a trend that is expected to continue over the next four years, and likely beyond.
The population growth over the past several years has been steady until the pandemic temporarily drove people from the density of cities in 2020 and 2021.
The population of Houston over the past several years is as follows:
- 2017: 2,313,079
- 2018: 2,314,478
- 2019: 2,315,720
- 2020: 2,300,027
- 2021: 2,288,250
- 2022: 2,363,086
As noted above, in 2022, the population returned and exceeded pre-pandemic levels, a trend that occurred in many cities in the U.S.
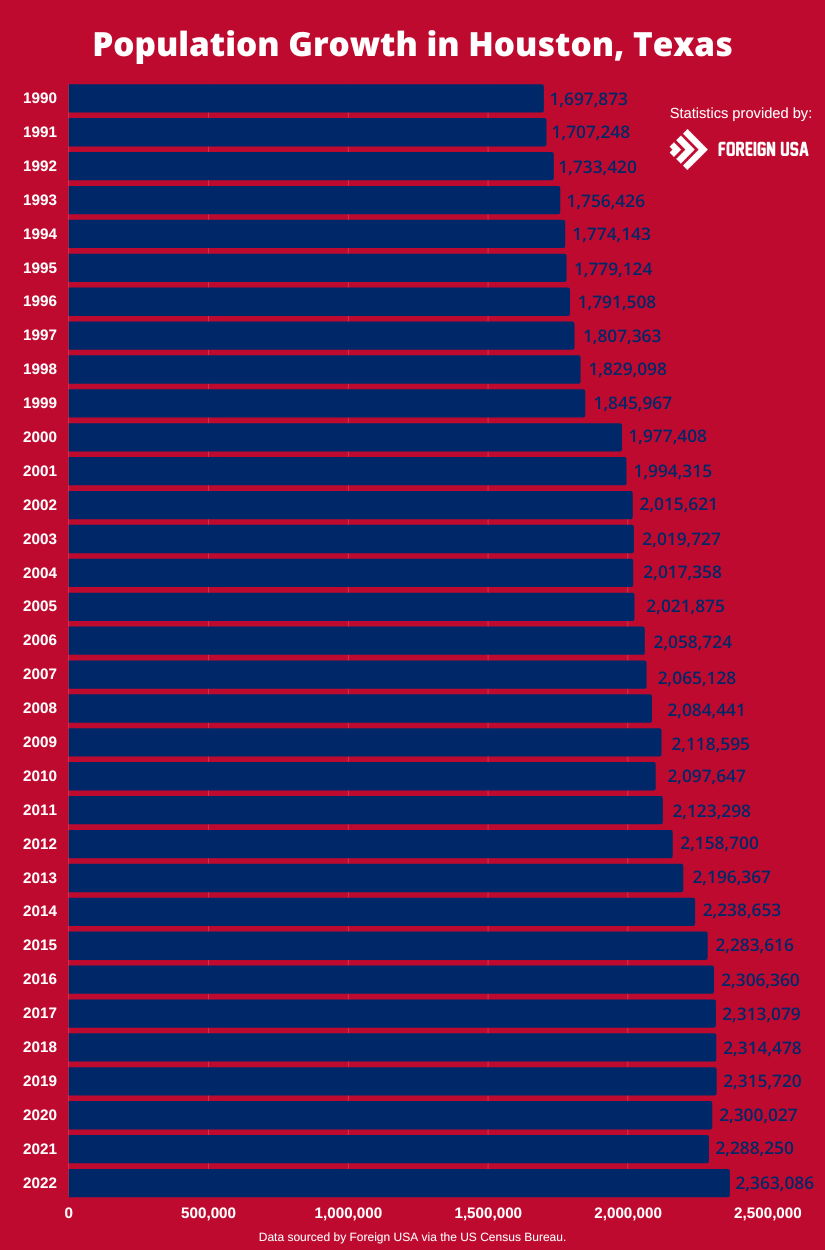
The in-depth graph below displays the population in Houston, Texas, each year since 1990:
While the population of the city shrunk, the larger Houston–The Woodlands–Sugar Land metro area did experience growth as people left the city for larger housing units with more space just outside of the city, but still in the Houston area.
Despite the pandemic temporarily impacting population growth in the city of Houston, the population’s growth has strong underpinnings. Houston is home to many important global industries, including energy, life sciences, technology, manufacturing, logistics, and aerospace.
As companies expand in and relocate to Houston, more and more people find the demographics of the city to be diverse, the median age to be relatively young, and earning potential to be high.
Houston Population Growth Chart and Table
The following table illustrates the growth in Houston’s population since 1990. You can see how much the population has increased steadily over the past 30+ years, with only a few instances where it decreased year-on-year.
The biggest decrease was just 1% from 2009 to 2010, and the highest year-on-year increase occurred from 1999 to 2000, which increased by a staggering 7.1%!
| Year | Houston Population | Growth | Growth Rate |
|---|---|---|---|
| 2022 | 2,363,086 | 74,836 | 3.30% |
| 2021 | 2,288,250 | -11,777 | -0.50% |
| 2020 | 2,300,027 | -15,693 | -0.70% |
| 2019 | 2,315,720 | 1,242 | 0.10% |
| 2018 | 2,314,478 | 1,399 | 0.10% |
| 2017 | 2,313,079 | 6,719 | 0.30% |
| 2016 | 2,306,360 | 22,744 | 1.00% |
| 2015 | 2,283,616 | 44,963 | 2.00% |
| 2014 | 2,238,653 | 42,286 | 1.90% |
| 2013 | 2,196,367 | 37,667 | 1.70% |
| 2012 | 2,158,700 | 35,402 | 1.70% |
| 2011 | 2,123,298 | 25,651 | 1.20% |
| 2010 | 2,097,647 | -20,948 | -1.00% |
| 2009 | 2,118,595 | 34,154 | 1.60% |
| 2008 | 2,084,441 | 19,313 | 0.90% |
| 2007 | 2,065,128 | 6,404 | 0.30% |
| 2006 | 2,058,724 | 36,849 | 1.80% |
| 2005 | 2,021,875 | 4,517 | 0.20% |
| 2004 | 2,017,358 | -2,369 | -0.10% |
| 2003 | 2,019,727 | 4,106 | 0.20% |
| 2002 | 2,015,621 | 21,306 | 1.10% |
| 2001 | 1,994,315 | 16,907 | 0.90% |
| 2000 | 1,977,408 | 131,441 | 7.10% |
| 1999 | 1,845,967 | 16,869 | 0.90% |
| 1998 | 1,829,098 | 21,735 | 1.20% |
| 1997 | 1,807,363 | 15,855 | 0.90% |
| 1996 | 1,791,508 | 12,384 | 0.70% |
| 1995 | 1,779,124 | 4,981 | 0.30% |
| 1994 | 1,774,143 | 17,717 | 1.00% |
| 1993 | 1,756,426 | 23,006 | 1.30% |
| 1992 | 1,733,420 | 26,172 | 1.50% |
| 1991 | 1,707,248 | 9,375 | 0.60% |
| 1990 | 1,697,873 |
Diversity and Demographics of Houston
Houston is an incredibly diverse city with a significant international presence. It has a large African American population, Hispanic population, and Asian/Pacific Islander population relative to other cities in the U.S. The population in Houston is also high in the city.
The growth and size of the Hispanic population is largely due to the proximity of the city to Central and South America.
The large Asian/Pacific Islander population traces its roots to historical growth in Asian/Pacific Islander communities in the 1960s and 1970s as South Asians, Filipinos, Koreans, and Vietnamese arrived by the thousands and established temples, mosques, churches, and civic groups.
Towards the end of the Vietnam War, residents in Vietnam fled the country and settled in Houston, where a humid, coastal environment had many parallels with their homeland conducive to trades such as shrimping, fishing, and agricultural jobs.
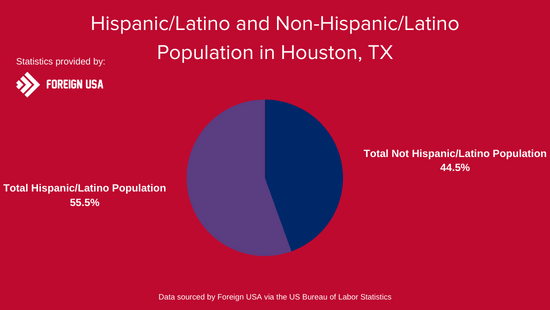
Hispanic and Latino Population in Houston
Approximately 55.5% of the population of Houston identifies as having Hispanic ethnicity, while 44.5% identify as non-Hispanic or Latino. The identification of being Hispanic crosses multiple races, meaning that this group draws from the white population, black population, and people of other races or those who comprise two or more races.
A significant volume of the Hispanic population is also Latino. To provide clarity on this, the Latino population consists of individuals from Latin America, while the Hispanic population consists of people who speak Spanish as a primary language or have Spanish heritage.
This means that a Brazilian who speaks Portuguese as their primary language may identify as Latino, but not Hispanic, while an El Salvadorean who speaks Spanish as their primary language may identify as both Latino and Hispanic.
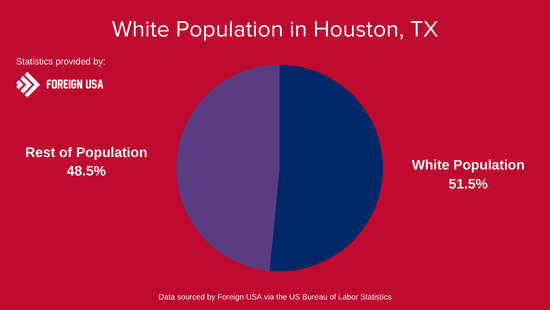
White Population in Houston
The population of white individuals in Houston is the largest of any demographic at 51.54% of the total population or 1,192,226 people.
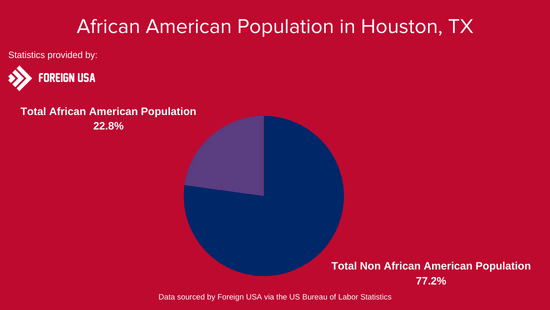
African American Population in Houston
The African American population in Houston is the second largest segment by race, at 22.8% of the total population or 528,145 people.
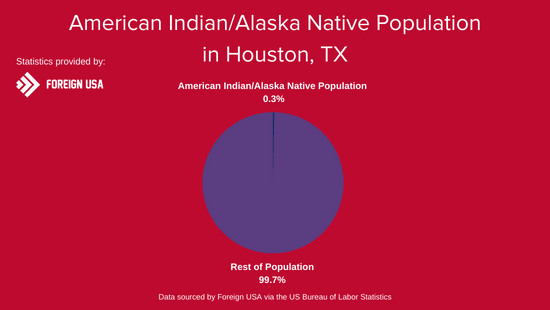
American Indian and Alaskan Native Population in Houston
The American Indian or Alaskan Native population in Houston is the second-smallest segment by race at 0.35% of the total population or 8,012 people.
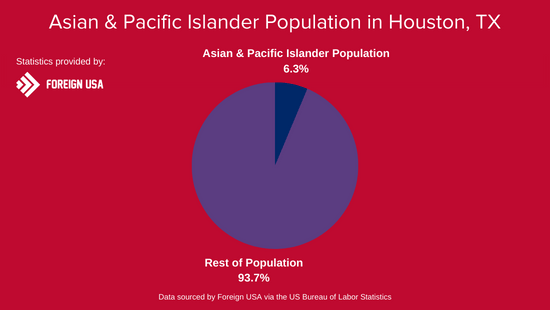
Asian Population in Houston
The Asian/Native Hawaiian/Other Pacific Islander population in Houston is sizable compared to many large cities in the U.S. at 6.3% of the total population or 159,941 people.
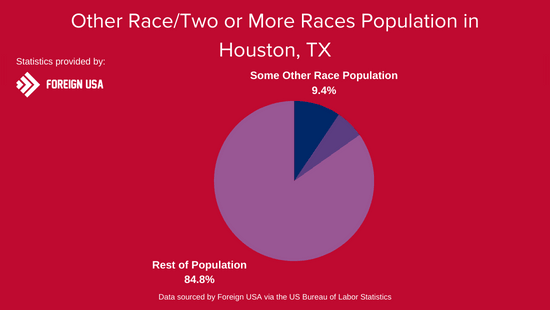
Other Race Populations in Houston
People who identify as a race other than White, African American, American Indian/Alaskan Native, or Asian/Native Hawaiian/Other Pacific Islander make up 9.4% of the total population, or 262,512 people, while those who identify with two or more races make up 5.8% of the total population, or 162,402.
The below graph displays the population of Native Hawaiian or other Pacific Islander populations in Houston, Texas.
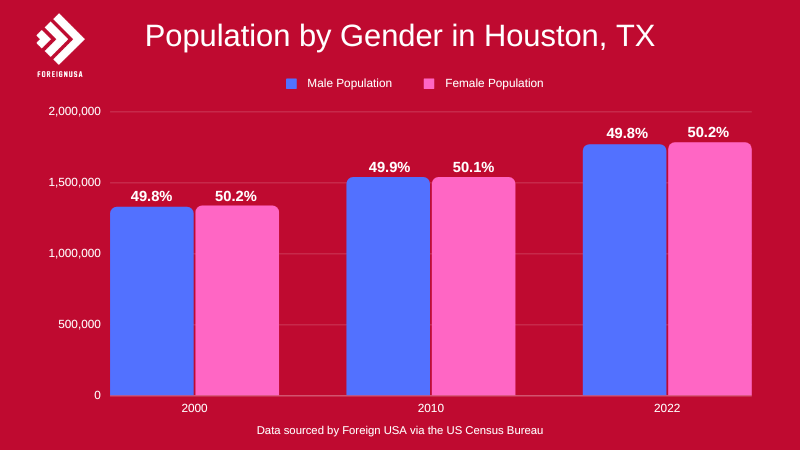
Female and Male Populations in Houston
In 2022, the city of Houston is estimated to have an extremely close ratio of men to women, with 1,182,537 males and 1,180,549 females – effectively 50% for each gender.